
W.S. Barkema1,2, G.A. Heckman3,4, S.E. Slaughter5, N. Carrier6, C.O. Lengyel7, H.H. Keller2,3
1. Human Nutrition, Wageningen University and Research, Wageningen, The Netherlands; 2. Department of Kinesiology, University of Waterloo, Waterloo, ON, Canada; 3. Schlegel-University of Waterloo Research Institute for Aging, Waterloo, ON, Canada; 4. School of Public Health and Health Systems, University of Waterloo, ON, Canada; 5. Faculty of Nursing, University of Alberta, Edmonton, AB, Canada; 6. École des sciences des aliments, de nutrition et d’études familiales, Faculté des sciences de la santé et des services communautaires, Université de Moncton, Moncton, NB, Canada; 7. Department of Food and Human Nutritional Sciences, University of Manitoba, Winnipeg, MB, Canada. Corresponding author: H. Keller, Schlegel-University of Waterloo Research Institute for Aging and Department of Kinesiology, University of Waterloo, 200 University Avenue West Waterloo, ON, Canada, N2L 3G1, Tel 519 888 4567 ext. 31761, Fax +1 519 746 6776, e-mail: hkeller@uwaterloo.ca
Jour Nursing Home Res 2019;5:49-55
Published online July 11, 2019, http://dx.doi.org/10.14283/jnhrs.2019.9
Abstract
Background: Frailty is common in long-term care (LTC) and leads to decreased survival. Certain diagnoses (asthma, heart failure (HF)), Chronic Obstructive Pulmonary Disease (COPD), depressive symptoms and chronic renal failure) are associated with frailty. Objective: This study investigated food and fluid intake of residents with certain diagnoses and if the conditions were independently associated with food intake. Design & participants: Cross-sectional study with 633 participants’ where three days of weighed food and fluid intake were observed. T-tests and multiple linear regression were used to analyze associations between energy, protein, fluid and Mean Adequacy Ratio (MAR) and diagnoses and their multi-morbidity. Covariates included age, BMI, sex, cognition, eating challenges, therapeutic diets, total medications, modified diet texture, malnutrition, oral health status affecting food intake and dysphagia risk. Results: Diet quality was moderate (MAR = 0.78-0.80) and mean daily energy, protein and fluid were 1554 (±295) kcal, 57.4 (±13.0) grams, and 1102 (±383) ml respectively. Diagnoses were not associated with energy, protein or fluid intake or MAR after adjusting for covariates. However, significantly higher fluid intake was seen in residents with HF (p=0.014) and multiple selected diagnoses (p =0.011) as compared to those without. Conclusion: Diagnoses were found to be irrelevant for explaining food and fluid intake of LTC residents. Other covariates, potential symptoms of the condition (e.g., dysphagia), were associated with intake, suggesting that the stage of frailty may be more relevant than the diagnoses leading to frailty with respect to food intake.
Key words: Long term care, older adults, nutritional intake, frailty, medical diagnosis.
Introduction
Frailty – a state of increased vulnerability – develops as a consequence of a decline in many systems that occur with aging; older adults living in long term care homes [LTC] are more likely to be frail as compared to community-living older adults (1). Asthma, Heart failure (HF), Chronic Obstructive Pulmonary Disease (COPD), depressive symptoms and chronic renal failure are associated with frailty (2), and survival is lower in frail individuals with these conditions (3). Residents in LTC are also a vulnerable group nutritionally; they often do not meet dietary recommendations for macro- and micro-nutrients, as well as fluid (4, 5). Poor nutrition impacts the survival of those who are frail (6) and may compound the effect of disease conditions that are associated with frailty. For example, being underweight is an important independent risk factor for mortality, irrespective of COPD stage (7). Yet, it is unclear if the health condition itself is the basis for inadequate food intake potentially resulting in unintentional weight loss, or that the symptoms (e.g., dysphagia) that are common with certain health conditions, lead to these nutritional challenges.
There are several potential mechanisms by which specific health conditions associated with frailty may impair food intake. Breathlessness and chest tightness are symptoms of COPD (8); poor energy and protein intake often accompany these symptoms (9). Decreased sense of hunger, nervousness, and depression have been demonstrated to affect food intake in those with HF (10). Weight loss and malnutrition are also prevalent in those suffering from HF with right heart overload and intestinal congestion (11). Poor food intake, nausea, and vomiting are some of the factors causing malnutrition in chronic renal failure (12). Functional disorders of the gastrointestinal (GI) system can also cause symptoms and distress without evidence of disease per se, such as dyspepsia, irritable bowel syndrome and chronic constipation (13, 14)resulting in low intake.
In addition to disease symptoms impacting food intake, several health conditions require a therapeutic diet for management. For example, a low sodium diet is commonly prescribed for HF (15, 16). However, a reduction in sodium intake could also lead to a decrease in total food intake (17). In renal diseases, nutritional therapy is important as diets can prevent symptoms or complications such as fluid retention (18). Therefore, it is important to consider any potential disease-specific advantages of a restricted diet that may be offset by the potential harm related to the effect of the therapeutic diet on the resident’s frailty.
Further, the additive effect of diagnoses that may promote frailty (i.e., asthma, COPD, HF, depression, renal and GI diagnoses) and their impact on food intake should also be considered. Based on a well-known frailty definition, an accumulation of deficits is expected to lead to greater frailty (19). Previous research suggests that when both asthma and depression are present there are poorer outcomes, including lower quality of life and body weight (20). Severe symptoms of depression are also independently associated with all-cause mortality in patients with HF (21). Declining renal function might also contribute, indirectly or directly, to the development of HF and patients with an exacerbation of COPD are prone to experience a deterioration in cardiac function (22). Thus, when examining the impact of a diagnosis on food intake, comorbidity of conditions should also be considered.
Although COPD, asthma, HF, depression, renal and GI diseases have been shown to be negatively associated with food intake, limited research has been conducted in LTC residents. Further, it is unclear if any association identified is independent of symptoms and conditions that also can contribute to or be a result of frailty, such as multi-morbidity, eating challenges, dysphagia, and malnutrition. The primary aim of this secondary data analysis was to investigate the current intake of LTC residents with chronic diagnoses of interest (i.e., COPD, asthma, HF, depression, renal and GI) known to be associated with impaired food and fluid intake. Next, this study determines if the influence of disease condition is independent of other factors such as therapeutic diets and factors that promote frailty. With this knowledge, the quality of life of the residents with these selected diagnoses could be improved with targeted, preventative dietary interventions.
Methods
Study population
This secondary data analysis was based on the Making the Most of Mealtimes study (M3), with a cross-sectional design and multi-site data collection on food and fluid intake and its determinants in four Canadian provinces (Alberta, Manitoba, Ontario, and New Brunswick). Data collection took place in 2015-2016 and included resident, care staff, dining room, and home level variables (23). A purposive sample of eight homes was recruited in each province (total n= 32) to obtain diversity in model of care, profit status, size, cultural factors, region, and other factors potentially influencing food and fluid intake. Within the homes, 20 residents were randomly recruited, resulting in a final sample of 639 residents as one resident dropped out. Eligible residents were: over the age of 65 years; required at least 2 hours of care per day; had resided in the home for at least 1 month and they or their substitute caregiver gave written consent for inclusion in the sample. Residents were ineligible if they: were medically unstable; were temporary residents; required tube feeding; did not eat routinely in the dining area; or had advanced directives excluding them from research. Residents with food intake recorded for at least six meals (n=633) were included in this analysis. Ethics review and clearance for this study was provided by the research boards of the Universities of Waterloo, Manitoba, Alberta, and the Université de Moncton.
The independent variables for analysis were medical diagnoses (mostly noted on the resident health care record) known to influence food intake: COPD, asthma, HF, depression (collected with InterRAI LTCF rating Depression Rating Scale (DRS) of 3 and higher (24)), renal and GI conditions. The DRS which is appropriate for LTC residents and is associated with “conspicuous depression” (24) has a score of 0-14 based on team member observation of depressive symptoms including crying, sad facial expressions and negative statements (24). Diagnostic data were coded to create subgroups of residents with each of these selected diagnoses. As well, a selected diagnosis multi-morbidity variable was created, defined as having two or more of these selected conditions, other comorbidity was defined as two or more other diagnoses.
The dependent variable was food and fluid intake. Fluid was based on volume consumed from beverages and soups. Food and fluid intake for 3 non-consecutive days were recorded by weighing or estimating all individual food/beverage items. This comprised of meals and the between meals (snacks) for 2 weekdays and 1 weekend day. Food intake (including prescribed oral nutritional supplements) was analyzed with the ESHA Food Processor Nutrition Analysis software version 10.14.1 (ESHA Research, Salem, OR, USA) using the Canadian Nutrient File where appropriate for fortified and other foods specific to the Canadian food supply (23). The usual intakes of nutrients were estimated by adjusting 3-day average intakes for intra-individual variation (25). Further details on food and fluid intake estimation are described in the M3 protocol (23). Absolute energy and protein intake were used in this analysis. The Mean Adequacy Ratio [MAR] was calculated to evaluate an individual’s intake of nutrients relative to their age/sex requirement and provides a sense of diet quality (26). The MAR is based on 17 nutrient adequacy ratios [NAR] for individual vitamins and minerals (calcium, copper, folate, iron, magnesium, phosphorus, selenium, vitamins A, B1, B2, B3, B6, B12, C, D, E [α-tocopherol], and zinc). The NAR is the intake of a given nutrient relative to the Recommend Daily Allowance (RDA) for that nutrient; percentage of the corresponding RDA for each nutrient is determined to a maximum of 1.0, indicating that the RDA for the nutrient was met/exceeded. MAR is determined by summing the NAR for all 17 nutrients and dividing by the number of nutrients assessed to obtain the average or mean adequacy ratio. Micronutrient supplements (i.e., pills) were not included in the calculation of the NARs.
Covariates included in this analysis were: age; Body Mass Index (BMI) (height was estimated with an ulna measurement completed by a research associate (27)); sex; cognition (using interRAI (Resident Assessment Instrument) Cognitive Performance Scale (CPS, (28)); eating challenges as measured with the Edinburgh Feeding Evaluation in Dementia Questionnaire (Ed-FED, (29, 30)); prescribed therapeutic diet (excluding modified texture); total medication usage; modified diet texture; malnutrition (based on PG-SGA (Patient-Generated Subjective Global Assessment, B or C categories (31)), dysphagia risk, and oral health status affecting food intake (based on standardized exam completed by a trained dental hygienist based on the Canadian Health Measures Survey (32)). CPS is a valid and reliable assessment of cognitive status (28) with scores ranging from 0 (intact, no cognitive impairment) to 6 (very severe cognitive impairment). Team members identify capacity of residents for decision making, making themselves understood, their short-term memory and self-feeding ability and an algorithm is used to determine the CPS score (28). The Cognitive Performance Scale (CPS) was categorized as no impairment (score < 3) or some impairment (score 3+) for this analysis. The Ed-FED is a 10-item scale that identifies frequency of common eating challenges for persons with dementia. This scale ranges from 10-30 and has demonstrated validity and reliability (29, 31); it was completed at three meals for each resident by research assistant observation. The first item of the Ed-FED, which assessed eating challenges, was used to describe the need for eating assistance (0= no physical assistance required; 1= any physical assistance required). PG-SGA is a valid tool (30) that assesses malnutrition and is growing in its use in diverse settings. The clinical ratings of A (well nourished), B (suspected/moderate malnutrition) and C (malnourished) were used rather than the numerical score (23). Residents were considered at dysphagia risk when they were prescribed thickened fluids, coughed or choked during mealtime observations or failed the standardized Screening Tool for Acute Neuro Dysphagia, a valid measure for stroke patients (32). Modified diet textures were grouped into two groups for analysis based on the International Dysphagia Diet Standardization Initiative (IDDSI) categorization (33): regular (IDDSI 7) and soft and bite-sized (IDDSI 6) was the reference; and minced and moist (IDDSI 5), pureed (IDDSI 4) and liquidized (IDDSI 3) were grouped together.
Statistical Analyses
SAS© software package version 9.4 (SAS Institute) was used for all analyses. Descriptive statistics included mean values, standard deviations, percentages, and frequencies. The mean and standard deviations of the average intake for energy, protein, fluid intake, and MAR were calculated per selected chronic diagnosis of interest and their multi-morbidity. T-tests were used to compare intake in those with and without each selected diagnosis; a p-value of < 0.05 was used to determine statistical significance. To demonstrate overlap in conditions that contribute to or are a result of frailty, proportions of co-occurrence were calculated. This was done for residents having each selected condition and key covariates of dementia, dysphagia risk, modified texture diets, prescribed diets and malnutrition. Multiple linear regression models examined the associations between diagnoses and their multi-morbidity with covariates for the dependent variables of MAR, fluid, energy and protein intake. Parameter estimates, 95% CI and the R2 (in supplementary table) were used to determine the variance in the dependent variable that is explained by the inclusion of the selected diagnosis in a fully adjusted model with all covariates included. Beta coefficients demonstrate the magnitude of the association between the independent and dependent variable.
Results
Resident characteristics and intake
Six people were excluded from analyses who had fewer than 6 of 9 mealtime observations, resulting in a sample of n=633. The majority of the sample was female (69%) with an average age of 87 ± 8 years and BMI of 25.4 ± 5.7 kg/m2 (Table 1). On average, residents were prescribed approximately eight medications, and malnutrition was seen in 44% of residents. Of all the selected diagnoses, GI diagnoses were the most prominent followed by depression, 34% and 33.5% respectively. Asthma was the least common with a prevalence of 5% in the sample. On average, residents had 5 diagnoses, including the selected diagnoses, and approximately 71% suffered from one or more of the selected diagnoses. Multi-morbidity (i.e., two or more) of selected diagnoses was seen in 32.7% of the residents. Of all residents, 37.8% followed a prescribed diet and 32.9% residents received modified textured food (IDDSI-categories 3-5). Of all residents assessed, 11.1% received a pureed or liquid texture, and 10.6% received thickened fluids. Dysphagia risk was seen in approximately 59% or the residents. Approximately 23% of the residents received physical assistance to eat during mealtimes. Oral health affected food intake in 49.3% of residents. As seen in Table 1, the average 3-day intake of all residents was 1554 ± 295 calories and 57.4 ± 13.0 grams of protein, following a normal distribution with a relatively large standard deviation. The average fluid intake was 1102 ± 383 ml and the MAR was 0.79 ± 0.09.
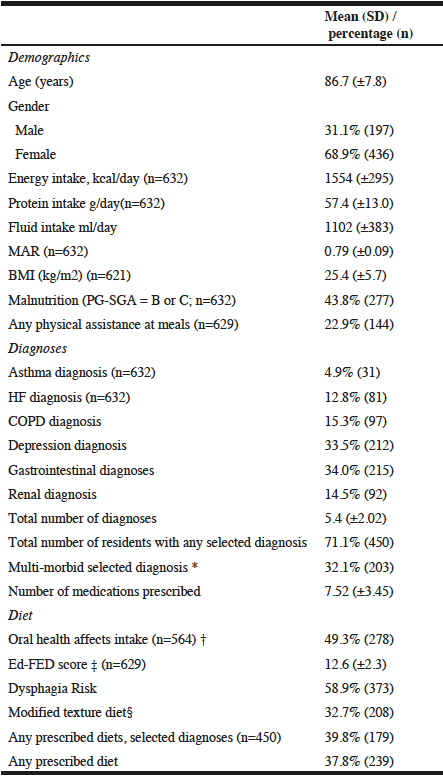
Table 1
Characteristics of the residents in the Making the Most of Mealtimes (M3) study (n=633)
* Selected chronic diagnoses of interest: Asthma, heart failure (HF), Chronic Obstructive Pulmonary Disease (COPD), Depression (classified as Depression Rating Scale of 3 and higher), GI diseases and renal diseases; † Only 564 had an oral exam sufficient to determine if oral health impacted food intake; ‡ Ed-FED score, based on the Edinburgh-Feeding score scale; scores range from 10 – 30; § Based on International Dysphagia Diet Standardization Initiative (IDDSI) classification, 3-5; kcal, kilocalorie; g, gram; ml, milliliter
Table 2 shows the frequency of co-occurrence of the chronic conditions of interest, as well as, dementia, dysphagia risk, malnutrition, modified textured foods, and any diet prescription. Some conditions were more prominent within residents with certain diagnoses. There was relatively little co-occurrence of the chronic conditions of interest, excepting for depression, which was comorbid with GI for more than 10% of the residents with this diagnosis. Of the chronic conditions of interest, GI conditions had the highest proportion with malnutrition and dysphagia risk at 17% and 21% respectively. Depression was the chronic condition of interest with the highest co-occurrence with dementia at 20%. Modified texture food was most often seen in residents with dementia and dysphagia risk. Most prescribed diets (including modified texture diets) were seen in residents at risk for dysphagia.
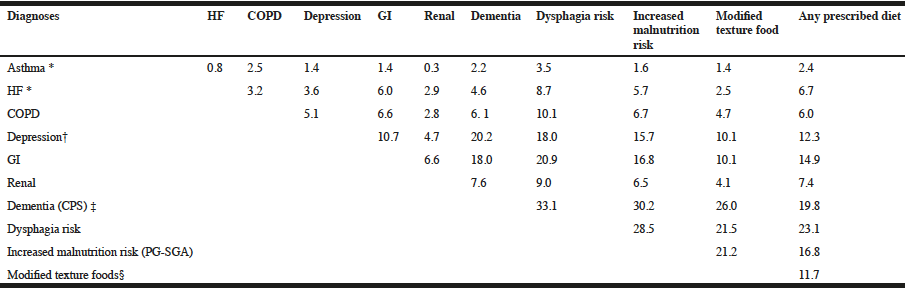
Table 2
Co-occurrence (%) of chronic conditions of interest with resident characteristics of dementia, dysphagia risk, use of prescribed diet, modified texture diet and malnutrition (n=633)
* Contains missing values † classified as Depression Rating Scale 3 or higher; ‡CPS score of 3 or higher indicates moderate to severe cognitive impairment; § Based on International Dysphagia Diet Standardization Initiative (IDDSI) classification, 3-5. COPD, chronic obstructive pulmonary disease; HF, heart failure; GI, gastro-intestinal diseases; PG-SGA, Patient-Generated Subjective Global Assessment; CPS, Cognitive Performance Score.
Table 3 presents the energy, protein, MAR and fluid intake by the selected health diagnoses of interest; very little variation was noted; there was a less than 100 calorie difference among diagnoses. HF participants had the highest energy (1586 ± 273 calories), protein (58.4 ± 11.8 grams), fluid (1200 ± 394 ml) and MAR scores (0.80). Multi-morbidity either overall or with selected diagnoses resulted in values consistent with the group average. There was no statistically significant difference when comparing residents with and without the specific diagnostic groups for energy, protein, and MAR. The exception was fluid; a significantly higher fluid intake (p-value = 0.014) was seen in HF and in multi-morbidity of selective diagnoses (p-value = 0.011).
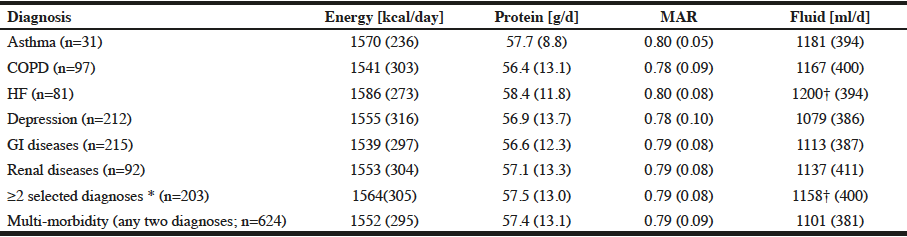
Table 3
Mean energy, protein, MAR intake and fluid intake by diagnosis in the Making the Most of Mealtimes (M3) study (n=633)
* Selected chronic diagnoses of interest: Asthma, HF, COPD, Depression (classified as Depression Rating Scale or 3 or higher), GI diseases and renal diseases; COPD, chronic obstructive pulmonary disease; HF, heart failure; GI, gastrointestinal diseases; † is below P = 0.05; kcal, kilocalorie g, gram; ml, milliliter
Regression analyses
Tables 4 shows the regression analyses performed on the outcome variables of energy, protein, MAR and fluid intake with the covariates expected to affect food and fluid intake (34). All the models contain the same independent variables and details on these covariate associations can be found in the supplemental tables. Covariates in the model that were significantly associated with energy were age, sex, malnutrition, Ed-FED score and eating assistance. All covariates were negatively associated with energy intake, except male sex, which was positively associated. Adding the selected diagnoses individually did not influence models. The associated covariates and their direction remained the same. For protein intake, the same five associations were observed. In addition, modified food textures showed a positive association with protein intake. Selected diagnoses did not change the models significantly. For the MAR score, there were four significant associations found, namely, age, malnutrition, Ed-FED score and requiring eating assistance, all negatively associated with this diet quality outcome. Lastly, fluid intake showed associations with sex, any diet prescription, cognition, malnutrition, and sex. Both cognitive impairment and malnutrition had a negative association with fluid intake while being male and any diet prescription had a positive association.
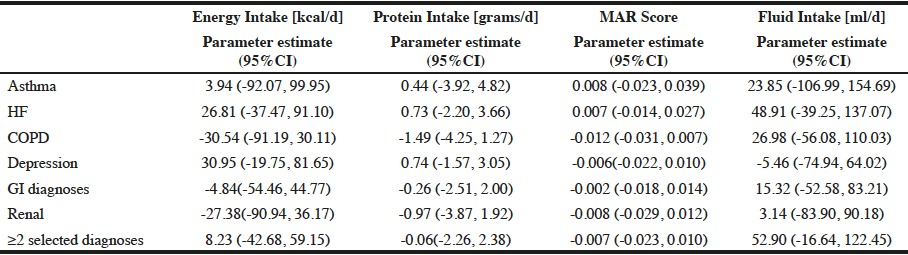
Table 4
Multiple linear regression analysis of diagnosis variables associated with energy intake (kcals/day), protein intake (grams/day), MAR Score and fluid (ml/day) adjusted for covariates* in the Making the Most of Mealtimes (M3) study (n=633)
*Covariates adjusted for are: age; BMI (height estimate with ulna measurement); gender; cognition (CPS scale 3-6 [using interRAI Cognitive Performance Scale]); eating challenges as measured with the Edinburgh Feeding Evaluation in Dementia Questionnaire (Ed-FED); prescribed therapeutic diet (excluding modified texture); total medication usage; modified diet texture based on International Dysphagia Diet Standardization Initiative (IDDSI) classification,3-5; malnutrition (based on PG-SGA, B or C categories), oral health status affecting food intake (based on standardized exam completed by a trained oral hygienist) and dysphagia risk. †Selective diagnoses: Asthma, HF, COPD, Depression (classified as Depression Rating Scale or 3 or higher), GI diseases and renal diseases; COPD, chronic obstructive pulmonary disease; HF, heart failure; GI, gastrointestinal diseases. No significant differences were found
Discussion
This study looked at specific conditions of interest (e.g., asthma, COPD, HF, depression, GI conditions, and renal failure), that have the potential to negatively influence intake, both independently and combined, to see if these diagnoses were associated with the energy, protein, and fluid intake or nutrient quality consumed. Certainly, these analyses confirmed that residents in LTC have low intakes of micronutrients and fluid, as in previous analysis with this sample (4, 5) and by others (35). The results showed no significant differences between residents with selected diagnoses or their multi-morbidity and those without these conditions in their energy and protein intake or diet quality. Significant differences in fluid were seen in HF and multi-morbidity of selected diagnoses in descriptive analyses, but were no longer significantly different when other covariates were assessed. Adjustments for covariates known to influence food intake, such as sex, age, malnutrition, eating challenges, food textures and diet prescriptions were included in this analysis, and several were found to be negatively associated with intake. This indicates that the selected diagnoses have minimal to no effect on food and fluid intake when adjusting for the covariates included in the analysis, but more fundamental issues such as dysphagia risk and malnutrition do influence intake.
Most residents in LTC are approaching the end of their life, and thus the lack of association between diagnosis and food and fluid intake can be explained in several ways. First, to be included in this study, residents were medically stable. They were not experiencing exacerbations of their disease state, such as hospitalization for fluid overload in HF. Findings could also suggest that these conditions were being sufficiently managed, such that when stable these conditions did not influence nutritional intake. Diets have been designed with the aim of improving intake while optimally managing specific chronic conditions (18, 15). In contrast, the finding that dysphagia risk, malnutrition and the requirement for modified textures are associated with reduced caloric intake suggest that greater attention to frailty is required when designing diets for LTC residents, and that priority should be given to improving both macro- and micro-nutrient and fluid intake. These conditions are often manifestations of advanced frailty, which for older adults is a more overarching health concern then specific diagnoses. Another explanation for a lack of effect is that the resulting symptoms and sequelae of these conditions, included in the multivariate analysis, are what explains the difference in food intake. For some diagnoses, but not for all (e.g., depression), this may be the most compelling reason for a lack of effect on intake (e.g., COPD and dysphagia). Dysphagia risk, malnutrition and the requirement of modified textures may also be considered ‘end stage’ conditions; although the selected health conditions assessed in this analysis may lead to frailty, the conditions of dysphagia and malnutrition demonstrate the presence of frailty.
Limitations
This study is not without limitations. Residents who volunteered and were recruited were medically stable. Furthermore, if they were unwell on a day of food intake data collection and could not come to the dining room, their observation was cancelled for that day and picked up at a later point while data collection occurred in the home. This may have overestimated the observed food intake for health conditions prone to exacerbations, as all of the residents were medically stable. Although rigorously collected, food intake was collected for only 3 days and there are known errors with nutrient analysis (36). Thus, intake data was only an estimation. This was a cross-sectional study, and assessing intake longitudinally would give a better indication of how a chronic health condition influences food intake. To prevent over-parameterization, potential covariates at the staff or environment level (23), were not modelled. This is justified because prior analyses for the M3 study have demonstrated resident level variables to have the greatest impact on food intake (34).
Conclusion
This is the first study that investigated the association of specific diagnoses and multi-morbidities with fluid, energy, and protein intake, as well as, diet quality in LTC residents. The analyses demonstrated low diet quality. In addition, it demonstrated that the chronic diagnoses of interest do not have a significant influence on the food intake of residents and that the conditions were not independently associated with nutritional intake. Eating challenges, such as dysphagia risk or malnutrition have a greater impact on food and fluid intake and are likely reflections of advanced frailty. These data suggest that ensuring the stability of chronic conditions may help optimize caloric intake and that designing diets for LTC should focus more broadly on addressing the needs of the nutritionally vulnerable and frail resident.
Acknowledgments: The authors wish to acknowledge the support of the research team, homes and residents in this data collection.
Funding: Funding for this project was received from the Canadian Institutes of Health Research (CIHR). CIHR has no involvement with the design of the study, the analysis or interpretation of data. The sponsors had no role in the design and conduct of the study; in the collection, analyses, and interpretation of data; in the preparation of the manuscript; or in the review or approval of the manuscript. Drs. Keller and Heckman are supported by the Schlegel Research Chairs.
Conflict of interest: The authors declare no conflicts of interest.
Ethical standard: Ethical review and clearance was provided by the four universities where the authors are affiliated.
References
1. Clegg A, Young J, Iliffe S, Rikkert M, Rockwood K. Frailty in elderly people. The Lancet. 2013;381(9868):752-762.
2. Ng T, Feng L, Nyunt M, Larbi A, Yap K. Frailty in Older Persons: Multisystem Risk Factors and the Frailty Risk Index (FRI). Journal of the American Medical Directors Association. 2014;15(9):635-642.
3. Lahousse L, Ziere G, Verlinden V, et al. Risk of Frailty in Elderly With COPD: A Population-Based Study. The Journals of Gerontology Series A: Biological Sciences and Medical Sciences. 2015;71(5):689-695.
4. Keller H, Lengyel C, Carrier N, et al. Prevalence of inadequate micronutrient intakes of Canadian long-term care residents. British Journal of Nutrition. 2018;119(09):1047-1056.
5. Namasivayam-MacDonald A, Slaughter S, Morrison J et al. Inadequate fluid intake in long term care residents: prevalence and determinants. Geriatric Nursing. 2018;39(3):330-335.
6. Casas-Vara A, Santolaria F, Fernández-Bereciartúa A, González-Reimers E, García-Ochoa A, Martínez-Riera A. The obesity paradox in elderly patients with heart failure: Analysis of nutritional status. Nutrition. 2012;28(6):616-622.
7. Landbo C, Prescott E, Lange P, Vestbo J, Almdal T. Prognostic Value of Nutritional Status in Chronic Obstructive Pulmonary Disease. American Journal of Respiratory and Critical Care Medicine. 1999;160(6):1856-1861.
8. Devereux G. Session 1: Allergic disease Nutrition as a potential determinant of asthma. Proceedings of the Nutrition Society. 2009;69(01):1.
9. Yazdanpanah, L, Shidfar, F, Moosavi, AJ, Heidarnazhad, H, & Haghani, H. Energy and protein intake and its relationship with pulmonary function in chronic obstructive pulmonary disease (COPD) patients. Acta Medica Iranica, 2010;(6): 374-379.
10. Lennie T, Moser D, Heo S, Chung M, Zambroski C. Factors Influencing Food Intake in Patients With Heart Failure. The Journal of Cardiovascular Nursing. 2006;21(2):123-129.
11. Sze S, Pellicori P, Zhang J, Clark A. P1823Malnutrition and its association with congestion in chronic heart failure. European Heart Journal. 2018;39(suppl_1) DOI: 10.1093/eurheartj/ehy565.P1823.
12. Stenvinkel P, Heimbürger O, Lindholm B, Kaysen G, Bergström J. Are there two types of malnutrition in chronic renal failure? Evidence for relationships between malnutrition, inflammation and atherosclerosis (MIA syndrome). Nephrology Dialysis Transplantation. 2000;15(7):953-960.
13. Grassi, M, Petraccia, L, Mennuni, G, et al. Changes, functional disorders, and diseases in the gastrointestinal tract of elderly. Nutricion Hospitalaria. 2011;26(4):659-668.
14. Madhavan A, Lagorio L, Crary M, Dahl W, Carnaby G. Prevalence of and risk factors for dysphagia in the community dwelling elderly: A systematic review. The Journal of Nutrition, Health & Aging. 2016;20(8):806-815.
15. Abshire M, Xu J, Baptiste D, et al. Nutritional Interventions in Heart Failure: A Systematic Review of the Literature. Journal of Cardiac Failure. 2015;21(12):989-999.
16. Trieu K, Neal B, Hawkes C et al. Salt Reduction Initiatives around the World – A Systematic Review of Progress towards the Global Target. PLOS ONE. 2015;10(7):e0130247.
17. Jefferson K, Ahmed M, Choleva M, et al. Effect of a Sodium-Restricted Diet on Intake of Other Nutrients in Heart Failure: Implications for Research and Clinical Practice. Journal of Cardiac Failure. 2015;21(12):959-962.
18. Cupisti A, D’Alessandro C, Fumagalli G, et al. Nutrition and Physical Activity in CKD patients. Kidney and Blood Pressure Research. 2014;39(2-3):107-113.
19. Rockwood K, Mitnitski A. Frailty in Relation to the Accumulation of Deficits. The Journals of Gerontology Series A: Biological Sciences and Medical Sciences. 2007;62(7):722-727.
20. Patel P, Patel M, Baptist A. Depression and Asthma Outcomes in Older Adults: Results from the National Health and Nutrition Examination Survey. The Journal of Allergy and Clinical Immunology: In Practice. 2017;5(6):1691-1697.e1.
21. Pushkarev G, Fisher Y, Sapozhnikova A, Soldatova A, Enina T, Kuznetsov V. P5406Impact of depression on all-cause mortality in patients with congestive heart failure after cardiac resynchronization therapy. European Heart Journal. 2018;39(suppl_1) doi.org/10.1093/eurheartj/ehy566.P5406.
22. Rich M. Congestive Heart Failure In Older Adults: Epidemiology, Pathophysiology, and Etiology of Congestive Heart Failure in Older Adults. Journal of the American Geriatrics Society. 1997;45(8):968-974.
23. Keller H, Carrier N, Slaughter S, et al. Making the Most of Mealtimes (M3): protocol of a multi-centre cross-sectional study of food intake and its determinants in older adults living in long term care homes. BMC Geriatrics. 2017;17(1).
24. Koehler M, Rabinowitz , Hirdes J, Stones M, Carpenter GI, Fries BE, Morris JN, Jones RN. Measuring depression in nursing home residents with the MDS and GDS: an observational psychometric study. BMC Geriatrics. 2005;5:1.
25. National Research Council. Nutrient adequacy: assessment using food consumption surveys. Washington: National Academy Press; 1986.
26. Hatløy A, Torheim L, Oshaug A. Food variety—a good indicator of nutritional adequacy of the diet? A case study from an urban area in Mali, West Africa. European Journal of Clinical Nutrition. 1998;52(12):891-898.
27. Finch H, Arumugam V. Assessing the accuracy and reliability of direct height measurement for use in adult neurological patients with contractures: a comparison with height from ulna length. Journal of Human Nutrition & Dietetics. 2014;Supp 2: 48-56.
28. Perlman CM, Hirdes JP, Barbaree H, Fries BE, McKillop I, Morris JN, Rabinowitz T. Development of mental health quality indicators (MHQIs) for inpatient psychiatry based on he interRAI mental health assessment. BMC Health Services Research. 2013;13:15 doi: 10.1186/1472-6963-13-15.
29. Watson R, Green SM, Legg L. The Edinburgh Feeding Evaluaion in Dementia Scale #2 (EdFED #2): Convergent and discriminant validity. Clinical Effectiveness Nursing. 2001;5(1):44-46.
30. Watson R, MacDonald J, McReady T. The Edinburgh Feeding Evaluaion in Demenia Scale #2 (EdFED #2): inter- and intra-rater reliability. Clinical Effectiveness Nursing. 2001;5(4):184-186.
31. Marshall S, Young A, Bauer J, Isenring E. Malnutrition in geriatric rehabilitation: prevalence, patient outcomes, and criterion validity of the scored Patient-Generated Subjective Global Assessment and the Mini Nutritional Assessment. Journal of the Academy Nutrition and Dietetics. 2016;116(5): 785-94.
32. Statistics Canada. Canadian Health Measures Survey (CHMS). Cycle 2 2009-2011. Statistics Canada. http://www23.statcan.gc.ca/imdb/p2SV.pl?Function=getSurvey&Id=62444#a2 Accessed Dec 2016.
33. Cichero JAY, Lam P, Steele CM, Hanson B, Chen J, Dantas RO, Duivestein J, Kayashita J, Lecko C, Murray J, Pillay M, Riquelme L, Sanschus S. Development of International Terminology and Definitions for Texture-Modified Foods and Thickened Fluids used in dysphagia management: the IDDSI Framework. Dysphagia. 2017;32(2):293-314.
34. Keller H, Carrier N, Slaughter S, et al. Prevalence and Determinants of Poor Food Intake of Residents Living in Long-Term Care. Journal of the American Medical Directors Association. 2017;18(11):941-947.
35. Aghdassi E, McArthur M, Liu B, McGeer A, Simor A, Allard J. Dietary Intake of Elderly Living in Toronto Long-Term Care Facilities: Comparison to the Dietary Reference Intake. Rejuvenation Research. 2007;10(3):301-310.
36. Vucea V, Keller H, Morrison J, et al. Nutritional quality of regular and pureed menus in Canadian long term care homes: an analysis of the Making the Most of Mealtimes (M3) project. BMC Nutrition. 2017;3(1):80.