D. Miranda1, R. Cardoso1,2, R. Gomes3, I. Guimarães2, D. de Abreu2, C. Godinho1,2,3, P. Pereira3, J. Domingos1,2, N. Pona1, J.J. Ferreira1,2
1. CNS- Campus Neurológico Sénior, Torres Vedras, Portugal; 2. Clinical Pharmacological Unit, Instituto de Medicina Molecular, Faculty of Medicine, University of Lisbon, Portugal; 3. Instituto Superior de Ciências da Saúde Egas Moniz, Monte da Caparica, Portugal. Corresponding author: Joaquim J. Ferreira, Laboratório de Farmacologia Clínica e Terapêutica, Faculdade de Medicina de Lisboa, Av. Prof. Egas Moniz, 1649-028 Lisboa, Portugal, Phone + 351 21 7802120, Fax + 351 21 7802129, E-mail: joaquimjferreira@gmail.com
Jour Nursing Home Res 2016;2:76-82
Published online August 12, 2016, http://dx.doi.org/10.14283/jnhrs.2016.11
Abstract
Objectives: To determine and compare the frequency of undernutrition in institutionalized elderly patients with neurological diseases at admission using different nutritional assessment tools. Design: Cross-sectional observational study. Setting: One long-term care institution specialized in neurodegenerative diseases. Participants: 92 Elderly people (aged ≥ 65 years) with at least one neurological condition. Measurements: Mini Nutritional Assessment (MNA), body mass index (BMI), mid-arm (MAC) and calf circumferences (CC) were used for nutritional status assessment. Presence and severity of dysphagia, polypharmacy and feeding difficulties were also assessed. Results: According to MNA, 77.1% of the participants were undernourished at admission. BMI identified 46.8%, MAC identified 44.6% and CC identified 22.8% of undernourished participants. Undernutrition was more frequent in Alzheimer’s disease, stroke and dementia syndromes. 63% had dysphagia for at least one food consistence and most of these patients were malnourished. MNA revealed best concordance with BMI and MAC than with CC. BMI and feeding difficulties were the major risk factors for undernutrition. Conclusion: Undernutrition prevalence in institutionalized elderly with neurological diseases at admission is high. Nutritional assessment tools revealed low concordance between them.
Key words: Undernutrition, institutionalized, elderly, neurological diseases.
Introduction
Undernutrition in elderly people is a multifactorial problem. It is defined as a state resulting from a lack of uptake or intake of nutrition that leads to altered body composition, reduced fat-free mass (FFM), but specifically body-cell mass (BCM) and reduced function (1–3).
The prevalence of undernutrition increases in relation to the required level of care (2). In community-dwelling older adults it is estimated that 5 to 30% are undernourished, while in residential aged care settings it ranges from 16-70% (2). In nursing homes and long-term care facilities, 10 to 85% of the elderly are estimated to be undernourished depending on the assessment method used (1).
Alzheimer’s (AD) and Parkinson’s disease (PD) are two of the most common neurodegenerative diseases in geriatric populations (3). Both are associated with increased risk of unintended weight loss and undernutrition (1).
Importantly, institutionalized people with cognitive impairment (dementia) seem to be at higher risk of developing undernutrition, with more frequent unintended weight loss than non-institutionalized people with mild to moderate AD (1).
The prevalence of undernutrition specifically in institutionalized elderly people with neurological diseases has not been established. The frequency of undernutrition in the elderly in multiple settings as reported in the literature varies widely and depends on the assessment method.
The main objectives of this study are to describe the frequency of undernutrition in institutionalized elderly people with neurological diseases and to compare the results using different nutritional assessment tools. Additionally, we describe some of the major factors that can influence nutritional status in this population.
Methods
Study participants
The present cross-sectional observational study was conducted in a long-term care institution specialized in neurodegenerative diseases. Elderly people (aged ≥ 65 years) with at least one neurological condition admitted between March 2014 and July 2015 participated in this study. Neurological diagnosis was obtained by consulting the individual’s clinical history and/or through clinical investigation during institutionalization. Exclusion criteria included tube feeding at admission and the presence of major or clinical relevant edemas.
Evaluation and outcomes
The nutritional assessment protocol was performed at admission (first 48 hours) and included Mini Nutritional Assessment (MNA) and anthropometric measurements such as body mass index (BMI), calf (CC) and mid-arm circumferences (MAC).
Primary outcome was the frequency of undernutrition status and risk of undernutrition as measured by MNA at admission. Secondary outcomes were the comparison between frequencies of undernutrition according to different diagnostic criteria and analysis of the major factors that influence nutritional status in this population.
MNA is an 18-item questionnaire specifically validated for nutritional assessment of community and institutionalized elderly people (4). This questionnaire globally evaluates nutritional status by considering anthropometric measurements and eating habits, as well psychological and functional aspects (5). A total score <17 indicates undernutrition and 17-23.5 undernutrition risk, while > 24 is considered a normal nutritional status (4). Because of its characteristics, this questionnaire is not suitable for elderly people with tube feeding (TF), the reason why these patients were excluded from the study.
BMI is obtained by dividing weight (kg) by height squared (m2). In an elderly population, a BMI <22kg/m2 is considered undernutrition, while 22 to 23.9kg/m2 indicates a patient at risk. Normal nutritional status is considered to be represented by BMI values ≥24kg/m2 (6). Body weight was measured through a calibrated floor or chair scale. Population-validated body weight predictive equations (7) were applied when weighing was not possible (due to mobility limitations and/or lack of collaboration).
In elderly people, a CC <31cm is a good indicator of muscular depletion and risk of undernutrition (8). Edema in the left or both lower limbs overestimates CC, so people with edema were also excluded. MAC is measured in the non-dominant arm and compared to gender and age percentiles published by the Centre for Disease Control (CDC) (9). A percentile of <15th is considered undernutrition, between the 15th and 75th is normal and > 75th is considered overweight/obese.
Based on the literature, age, polypharmacy (use of ≥ 10 drugs) (10), number of comorbidities (11), length of stay after baseline assessment, anthropometric measurements (8)(12), presence and severity of dysphagia (13–15), and feeding difficulties (16) were selected as possible factors that can influence nutritional status.
A speech and language therapist performed the clinical assessment of dysphagia. The diagnostic criteria for dysphagia is the presence of at least one clinical sign of laryngeal penetration or aspiration (cough before, during of immediately after swallow, wet voice or need for cleaning the throat after swallow during the first meal in the institution). Severity of dysphagia and the need of food restrictions and adaptations in texture/consistency was assessed with the Functional Oral Intake Scale (FOIS) (17). This scale considers seven levels of severity, with seven indicating “no need of restrictions” and level one “food consumption by mouth is not indicated/safe”. Only people with FOIS ≥ level 4 were included because these levels are applicable in people without tube feeding.
The Edinburgh Feeding Evaluation in Dementia Questionnaire (EdFED-Q) evaluates the frequency of food-related behaviors (feeding difficulties) (18, 19). EdFED-Q cut-off points had not yet been established in previous studies, except for one study performed in Taiwan with demented elderly nursing home residents that concluded that a worse nutritional status was associated without a score < 5 (38).
Statistical Analysis
The comparison of the results obtained from different assessment tools was performed by evaluating the concordance between them, which was analyzed using the Kappa (k) statistic. The k value varies from 0 to 1, a value ≤0.2 = poor, 0.21-0.4 = fair, 0.41-0.6 = moderate, 0.61-0.8 = substantial, and >0.8 = almost perfect concordance. Receiver operating characteristic (ROC) curves of nutritional assessment instruments were constructed to evaluate their performance in correctly identifying undernutrition status according to the MNA. To construct ROC curves, individuals classified with “undernutrition” and “undernutrition risk” according to the MNA and their BMI were grouped in one single category. Sensitivity and specificity were calculated for a range of the instrument’s cut-off values. The areas under the ROC curves (AUCs) and their 95% confidence intervals (CIs) were also calculated. AUCs 0.9-1 = perfect sensitivity and specificity, 0.9-0.8 = good, 0.8-0.7 = fair, 0.7-0.6 = poor and <0.6 = useless (no better than chance). Multiple regression models were performed to identify factors that had a significant impact on nutritional status, selection of variables was performed through the application of stepwise regression. Statistical significance was set at p≤0.05 for all tests. All statistical analyses were carried out using the Software Package for Social Sciences (SPSS) for Windows, version 21.0.
Results
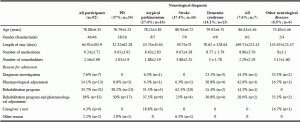
Ninety-two participants were included. Demographic and clinical data are presented in Table 1. A total of four patients were excluded due to TF and major edema at admission. PD was the most frequent neurological disease in the sample (37%) followed by atypical parkinsonism (17.4%), and stroke (17.4%), dementia syndrome (14.1%), AD (7.6%), and other neurological diseases (6.5%).
Nutritional status
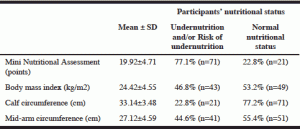
According to MNA, 77.1% of the participants were undernourished (21.7%; n=20) and/or at risk of undernutrition (54.4%; n=51) at the time of admission. BMI identified 46.8% of participants as being undernourished (28.3%; n=26) and/or at risk (18.5%; n=17). According to MAC and CC, undernutrition and/or risk was present in 44.6% and 22.8% of the participants, respectively (Table 2).
Undernutrition, according to MNA, was more frequent in AD, stroke and dementia syndromes (100%, 87.5%, and 84.6%, respectively). BMI revealed a higher frequency of undernutrition in AD participants, while MAC and CC identified higher frequencies of undernutrition in participants with other neurological diseases (Table 3).
MNA revealed the best concordance with BMI (58 participants had the same nutritional status) and the worst correlation with CC (agreement in only 38 participants). The overall best concordance was between BMI and MAC (66 participants).
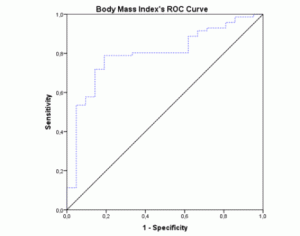
The ROC-curves and AUCs were calculated using MNA as the gold-standard method for nutritional status assessment. The ROC curve for BMI (figure 1) showed an AUC of 0.796 (95% CI 0.692-0.900; p<0.001). The AUC for the MAC values (figure 2) were similar (AUC=0.796; 95% CI 0.682-0.911; p<0.001). Both these instruments revealed a fair level of specificity and sensitivity. The AUC for CC (figure 3) revealed a poor level of specificity and sensitivity (AUC=0.697; 95% CI 0.579-0.815; p<0.001).
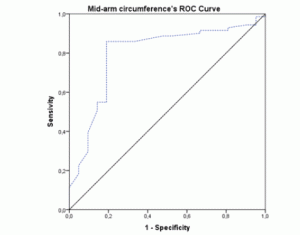
Figure 2 ROC curve of mid-arm circumference values using Mini Nutritional Assessment as the gold-standard
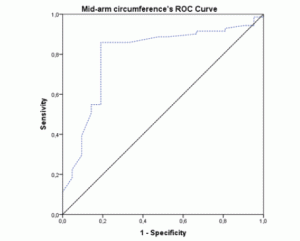
Figure 3 ROC curve of calf-circumference values using Mini Nutritional Assessment as the gold-standard
Multiple regression revealed significant results (p<0.001) for the EdFED-Q score and BMI as the major risk factors for undernutrition assessed with MNA. For each 0.4 point decrease in the EdFED-Q score, the MNA score increased one point; when BMI increased 0.4kg/m2 the MNA also increased one point (better nutritional status). EdFED-Q mean score was 3.5±3.9 points. Most of our sample had low scores, meaning there was no normal distribution. The variables age, length of stay, number of comorbidities, BMI, MAC, CC, FOIS and polypharmacy were excluded in the model.
Dysphagia
Data relatively to dysphagia are highlighted in Table 3. Dysphagia for at least one food consistency was present in 63% (n=58) of the participants and, of this group, 68% (n=45) were malnourished. Of the 23 participants with dysphagia only for liquids, 47% (n=16) were malnourished. This percentage increased in the subgroup of participants with dysphagia for more than one food consistency, 25 (83%) of 30 participants with dysphagia for more than one food consistency (dysphagic for at least two of these three consistencies: liquids, solid, mixed consistence) were malnourished. One patient had dysphagia only for mixed consistencies and he was malnourished. Four patients had dysphagia only for solid food and three of them were malnourished. Among the total sample, 34 (37%) had no dysphagia and, of these, 24 (76%) were malnourished according to MNA.
Discussion
The frequency of undernutrition in institutionalized elderly people with neurological diseases at admission is high (77% according to MNA). Depending on the nutritional assessment method, the frequency of undernutrition varies between 23% and 77%.
Reported prevalence of undernutrition in community-dwelling older adults with dementia is 47.8% – which is lower than the institutionalized elderly (20). A cross-sectional study conducted in several nursing homes in Spain assessing the nutritional status of the elderly with the MNA found a frequency of undernutrition/risk of 40.1% (21). Another study performed in long-term institutions in Brazil found 63.9% prevalence of undernourished elderly using MNA (22). In a sample of elderly nursing home residents (48.8% had dementia), Isenring et al found a 58.3% prevalence of undernutrition according to MNA (23). These results were close to those found by Stange et al. with a similar sample and assessment method (24).
Our study protocol was performed at early admission and it was verified that the nutritional risk was already higher than other studies with institutionalized elderly (most studies have no defined moment of assessment, so the patient included could have been institutionalized for years or only a few days).
Undernutrition was more frequent in participants with AD, stroke and dementia syndrome. Eating disorders, such as food refusal and severe feeding difficulties, are common in AD leading to weight loss and undernutrition (25). In our study, all AD elderly were undernourished at admission according to MNA. However, we have to consider that there is no representative number of AD participants in our sample. To our knowledge, no previous study has specifically determined the prevalence of malnutrition of institutionalized elderly with AD; however, some studies in community-dwelling AD older adults have found the prevalence of undernutrition to be 0-12.6% and the risk of undernutrition to vary from 14.1 to 55.9%.
In dementia syndromes such as Lewy body dementia and vascular dementia, the estimated prevalence of malnutrition in community-dwelling people is 77.3% and 49.1% at risk, respectively (26). In our study, the frequency of undernutrition is higher (84.6%) according to MNA.
People with PD were the group with the lowest frequency of undernutrition (62%). Previous studies using MNA found a low frequency of undernutrition/risk in community-dwelling or outpatients (0-22.9%) (27, 28). Fereshtehnejad et al. in a study performed with 143 Iranian PD patients, compared malnutrition prevalence with age- and sex-matched healthy controls and found no significant difference in their nutritional status for mild to moderate PD (29). To our best knowledge there are no other published studies reporting the frequency of malnutrition in institutionalized PD patients. For this reason, we cannot conclude if the high frequency of malnutrition at admission found in our study is associated with PD or just a consequence of a more advanced stage of the disease and frailty in patient’s clinical status.
Undernutrition was more frequent in the atypical parkinsonism group than in PD, possibly due to faster progression and severity of atypical parkinsonism diseases. Also, these people generally show higher rates of physical dependence and more severe dysphagia (20).
MNA is widely used in geriatric populations. In all patient-groups, MNA revealed higher frequencies of undernutrition compared with other instruments. This suggests that MNA has a high sensitivity to detect undernutrition in this population. BMI and MAC showed a good level of agreement in diagnosing undernutrition considering MNA results.
Mean values of BMI, MAC and CC in our study were similar to the results obtained by Machado and Coelho from institutionalized Brazilian older adults. However, MNA mean values were lower in our study confirming a higher nutritional risk in elderly people with neurological diseases (22).
Multivariate analyses identified BMI and feeding difficulties as predictive factors for undernutrition/risk. BMI is a simple and non-invasive measurement that is widely used to assess and monitor nutritional status. People with PD have, in general, a lower BMI than healthy controls (30). In dementia, little is known about the optimal BMI after diagnosis; however, people with dementia who have low BMIs have increased mortality risk than their peers (31). At the moment of admission, BMI combined with additional information about recent body weight changes (especially weight loss) provide important and comprehensive data about nutritional status. In the absence of information about recent weight fluctuation, BMI combined with additional information of body composition (CC and MAC) can guide the need for a nutritional intervention plan. Because BMI is more sensitive to energy balance and body weight changes than CC and MAC, it can be used to monitor short and long-term nutritional status (32). It is important to reinforce that BMI is limited as an isolated tool to assess nutritional status because it cannot assess body composition (lean mass and fat mass) and relevant changes in a stable BMI may not be detected.
Results from the EdFED questionnaire confirm malnutrition as being associated with feeding difficulties in institutionalized elderly with neurological diseases, and not only in people with dementia (16). EdFED revealed a significant correlation with MNA and BMI (p<0.05) and a significant correlation with CC (p<0.05). For this reason, the EdFED questionnaire may be a useful tool to predict undernutrition in this population who is particularly vulnerable to feeding problems. In our study, a cut-off of ≥2 points showed a significant association with a worse nutritional status (AUC 0.804; 95% CI 0.72-0.888) in elderly with neurological diseases. Our sample included several neurological diseases and had low EdFED scores, meaning that they had less feeding problems than older adults with dementia. Despite that, it seems that feeding difficulties may have a higher impact on nutritional status of elderly with neurological conditions. However, future studies should be conducted to determine cut-off points for specific neurological conditions.
Data relatively to dysphagia are in accordance with literature showing that it is frequent in neurological diseases, particularly in atypical parkinsonisms (13), stroke (14) and idiopathic PD (15). People with atypical parkinsonism and stroke needed more frequent use of food restrictions and adaptations due to the presence of more severe dysphagia (13, 14). An interesting result is that although the frequency of dysphagia is not high in dementia, this group revealed high use of food adaptation, which may be justified by the presence of altered food behavior, confirming the utility of these strategies to manage food difficulties, even in absence of dysphagia. The main advantage of this strategy is that it is completely passive and enables adequate intake of food when there is a lack of collaboration during meals. In opposition, despite the high frequency of dysphagia in people with PD, food adaptation and restriction were not so frequently used. Other strategies involving posture adjustments and portion control were applied to manage dysphagia, only possible due to the maintenance of cognitive abilities in this population. It is no surprise that undernutrition is more frequent in people with dysphagia for solid food compared to dysphagia for liquids (major nutritional intake comes from solid food). Surprisingly, dysphagia was not identified as a risk factor for malnutrition that is a well described relationship in elderly populations with neurological conditions like stroke (33), dementia (34) and parkinsonism (35) or without (36). Our results did not confirm this relationship probably due to reduced sample size.
Recently the European Society of Clinical Nutrition and Metabolism (ESPEN) published in Clinical Nutrition a consensus-based minimum set of criteria for the diagnosis of malnutrition (37). According to these consensus criteria only 28.3% of our sample is undernourished (we used MNA short-form as screening tool and considered undernutrition status for BMI<20kg/m2 for <70 years and BMI<22kg/m2 for ≥70 years).
This study highlights not only the high prevalence of undernutrition in institutionalized elderly people with neurological diseases, but also the importance of a comprehensive nutritional status assessment at admission. This may allow for an early, and sometimes preventive, nutritional intervention.
Future research should be conducted in a larger sample and consider other risk factors that have been associated with malnutrition. Feeding difficulties should be evaluated through validated screening tools with defined cut-off points.
One of our limitations was obtaining data only from patients admitted in one long-term care institution and results should be confirmed in further investigations with a larger sample. Also, our sample had different proportions of neurological conditions and it would be interesting to study nutritional status and risk factors individually. When comparing the frequency of undernutrion between different neurological diseases or different cohorts of patients, factors like disease severity, disease duration and global disability should be considered. Although in our study all patients included were at an advanced/late stage of their disease when comparing the frequency of undernutrion in between different etiologies we cannot exclude that factors related with disease severity may bias the conclusions.
Despite these limitations, we consider that this study has clinical implications and is relevant given the limited knowledge about the prevalence of undernutrition in this specific population.
The prevalence of undernutrition (according to MNA) in institutionalized elderly with neurological diseases at admission is high (77.1%). There was low agreement between nutritional assessment instruments, resulting in different frequencies of undernutrition prevalence. According to CC only 22.8% were undernourished or at risk, MAC identified 44.6% and BMI 46.8%. Feeding difficulties were found to be the major risk factor for undernutrition in this specific population. Early screening for feeding problems may be a crucial step in preventing or treating undernutrition. To prevent malnutrition problems nutritional counseling should be an integral part of a multidisciplinary approach in caring for the elderly with neurological diseases.
Author Roles: (1) Research Project: A. Conception, B. Organization, C. Execution; (2) Statistical Analysis: A. Design, B. Execution, C. Review and Critiques; (3) Manuscript: A. Writing of the First Draft, B. Review and Critique. D.M.: 1A, 1B, 1C, 2A, 2B, 3A, 3B, R.C.: 1A, 1C, 2A, 2B, 3A, 3B, R.G.: 1A, 1C, 3B, I.G.: 2C, 3B, D.A.: 2A, 2C, C.G.: 3B, P.P.: 3B, J.D.: 3B, N.P.: 3B, J.J.F: 1A, 1B, 2A, 2C, 3B
Acknowledgments:The authors are grateful to the subjects who have volunteered to participate in this study.
Conflict of interest: All authors declare no conflicts of interest.
Ethical standards: This experiment complies with current laws of the country in which they were performed.
Funding sources: None.
References
1. M. Carlsson, Nutritional status, body composition and physical activity among older people living in residential care facilities, 2011. http://www.diva-portal.org/smash/record.jsf?pid=diva2:416245.
2. E. Agarwal, M. Miller, a. Yaxley, E. Isenring, Malnutrition in the elderly: A narrative review, Maturitas. 2013;76 296–302. doi:10.1016/j.maturitas.2013.07.013.
3. J.M. Sheard, Malnutrition and Neurodegenerative Diseases, Curr. Nutr. Rep. 2014;3 102–109. doi:10.1007/s13668-014-0078-2.
4. M.H.V.S. Loureiro, Validação do mini-nutritional assesment em idosos internados, 2004.
5. J. Kondrup, S.P. Allison, M. Elia, B. Vellas, M. Plauth, ESPEN guidelines for nutrition screening 2002, Clin. Nutr. 2003;22 415–421.
6. A.L. Danielewicz, A.R. Barbosa, G.F. Del Duca, Nutritional status, physical performance and functional capacity in an elderly population in southern Brazil, Rev. Assoc. Med. Bras. 2014;60 242–248.
7. M. Barceló, O. Torres, J. Mascaró, E. Francia, D. Cardona, D. Ruiz, Assessing Nutritional status in the elderly; evaluation of Chumleas equations for weight, Nutr Hosp. 2013;28 314–318.
8. K.C. Portero-McLellan, C. Staudt, F.R.F. Silva, J.L.D. Bernardi, P.B. Frenhani, V.A.L. Mehri, The use of calf circumference measurement as an anthropometric tool to monitor nutritional status in elderly inpatients, J. Nutr. Heal. Aging. 2010;14 266–270. doi:10.1007/s12603-010-0059-0.
9. C.D. Fryar, Q. Gu, C.L. Ogden, Anthropometric reference data for children and adults: United states, 2007-2010, Vital Heal. Stat. Ser. 11 Data from Natl. Heal. Surv. Natl. Heal. Nutr. Exam. Surv. Hisp. Heal. Nutr. Exam. Surv. 2012;11 http://www.scopus.com/inward/record.url?eid=2-s2.0-84872950773&partnerID=40&md5=6e27f515a75d008256e913d9d13cb1ca.
10. P. Ramgoolie, S. Nichols, Polypharmacy and the Risk of Malnutrition among Independently-living Elderly Persons in Trinidad amd Tobago., West Indian Med. J. 2015.
11. B. Saka, O. Kaya, G.B. Ozturk, N. Erten, M.A. Karan, Malnutrition in the elderly and its relationship with other geriatric syndromes, Clin. Nutr. 2010;29 45–748.
12. M. Naseer, H. Forssell, C. Fagerström, Malnutrition, functional ability and mortality among older people aged ⩾ 60 years: a 7-year longitudinal study, Eur. J. Clin. Nutr. .
13. J. Müller, G.K. Wenning, M. Verny, A. McKee, K.R. Chaudhuri, K. Jellinger, et al., Progression of dysarthria and dysphagia in postmortem-confirmed parkinsonian disorders, Arch. Neurol. 2001;58 259–264.
14. R. Martino, N. Foley, S. Bhogal, N. Diamant, M. Speechley, R. Teasell, Dysphagia after stroke incidence, diagnosis, and pulmonary complications, Stroke. 2005;36 2756–2763.
15. J.G. Kalf, B.J.M. de Swart, B.R. Bloem, M. Munneke, Prevalence of oropharyngeal dysphagia in Parkinson’s disease: A meta-analysis, Parkinsonism Relat. Disord. 2012;18 311–315. doi:10.1016/j.parkreldis.2011.11.006.
16. C. Chang, B.L. Roberts, Feeding difficulty in older adults with dementia, J. Clin. Nurs. 2008;17 2266–2274.
17. M.A. Crary, G.D.C. Mann, M.E. Groher, Initial psychometric assessment of a functional oral intake scale for dysphagia in stroke patients, Arch. Phys. Med. Rehabil. 2005;86 1516–1520.
18. R. Watson, I.J. Deary, Feeding difficulty in elderly patients with dementia: confirmatory factor analysis, Int. J. Nurs. Stud. 1997;34 405–414.
19. R. Watson, J. MacDonald, T. McReady, The Edinburgh feeding evaluation in dementia scale# 2 (EdFED# 2): inter-and intra-rater reliability, Clin. Eff. Nurs. 2001;5 184–186.
20. M. Roque, A. Salva, B. Vellas, Malnutrition in community-dwelling adults with dementia (NutriAlz Trial), J. Nutr. Health Aging. 2013;17 295–299.
21. R. Serrano-Urrea, M.J. Garcia-Meseguer, Malnutrition in an elderly population without cognitive impairment living in nursing homes in Spain: study of prevalence using the Mini Nutritional Assessment test, Gerontology. 2013;59 490–498.
22. R.S.P. Machado, M.A.S.C. Coelho, Risk of malnutrition among Brazilian institutionalized elderly: a study with the Mini Nutritional Assessment (MNA) questionnaire, J. Nutr. Health Aging. 2011;15 532–535.
23. E.A. Isenring, M. Banks, M. Ferguson, J.D. Bauer, Beyond malnutrition screening: appropriate methods to guide nutrition care for aged care residents, J. Acad. Nutr. Diet. 2012;112 376–381.
24. I. Stange, K. Poeschl, P. Stehle, C.C. Sieber, D. Volkert, Screening for malnutrition in nursing home residents: comparison of different risk markers and their association to functional impairment, J. Nutr. Health Aging. 2013;17 357–363.
25. S. Spaccavento, M. Del Prete, A. Craca, P. Fiore, Influence of nutritional status on cognitive, functional and neuropsychiatric deficits in Alzheimer’s disease, Arch. Gerontol. Geriatr. 2009;48 356–360.
26. M. Roque, a. Salva, B. Vellas, Malnutrition in community-dwelling adults with dementia (Nutrialz Trial), J. Nutr. Heal. Aging. 2013;17 295–299. doi:10.1007/s12603-012-0401-9.
27. M. Barichella, M.C. Villa, A. Massarotto, S.E. Cordara, A. Marczewska, A. Vairo, et al., Mini Nutritional Assessment in patients with Parkinson’s disease: correlation between worsening of the malnutrition and increasing number of disease-years, Nutr. Neurosci. 2008;11 128–134.
28. G. Wang, Y. Wan, Q. Cheng, Q. Xiao, Y. Wang, J. Zhang, et al., Malnutrition and associated factors in Chinese patients with Parkinson’s disease: Results from a pilot investigation, Parkinsonism Relat. Disord. 2010;16 119–123.
29. S.-M. Fereshtehnejad, L. Ghazi, M. Sadeghi, D. Khaefpanah, G.A. Shahidi, A. Delbari, et al., Prevalence of Malnutrition in Patients with Parkinson’s Disease: A Comparative Study with Healthy Controls using Mini Nutritional Assessment (MNA) Questionnaire, J. Parkinsons. Dis. 2014;4 473–481.
30. M.A. van der Marck, H.C. Dicke, E.Y. Uc, Z.H.A. Kentin, G.F. Borm, B.R. Bloem, et al., Body mass index in Parkinson’s disease: a meta-analysis, Parkinsonism Relat. Disord. 2012;18 263–267.
31. S. García-Ptacek, G. Faxén-Irving, P. Čermáková, M. Eriksdotter, D. Religa, Body mass index in dementia, Eur. J. Clin. Nutr. 2014;68 1204–1209.
32. A.C.-H. Tsai, M.-C. Lai, T.-L. Chang, Mid-arm and calf circumferences (MAC and CC) are better than body mass index (BMI) in predicting health status and mortality risk in institutionalized elderly Taiwanese, Arch. Gerontol. Geriatr. 2012;54 443–447.
33. N.C. Foley, R.E. Martin, K.L. Salter, R.W. Teasell, A review of the relationship between dysphagia and malnutrition following stroke, J. Rehabil. Med. 2009;41 707–713.
34. C.S. Easterling, E. Robbins, Dementia and dysphagia, Geriatr. Nurs. (Minneap).2008;29 275–285.
35. J.M. Sheard, S. Ash, Current practice in nutrition assessment for the management of Parkinson’s disease in Australia and Canada, Nutr. Diet. 2014;71 92–99.
36. M. Serra-Prat, M. Palomera, C. Gomez, D. Sar-Shalom, A. Saiz, J.G. Montoya, et al., Oropharyngeal dysphagia as a risk factor for malnutrition and lower respiratory tract infection in independently living older persons: a population-based prospective study, Age Ageing.2012;41 376–381.
37. T. Cederholm, I. Bosaeus, R. Barazzoni, J. Bauer, A. Van Gossum, S. Klek, et al., Diagnostic criteria for malnutrition–an ESPEN Consensus Statement, Clin. Nutr. 2015;34 335–340.
38. Chang, C.C. Prevalence and factors associated with feeding difficulty in institutionalized elderly with dementia in Taiwan. The journal of nutrition, health & aging, 2012;16(3), 258-261.

